Uk Lotto:- Analysis of Sums    
The 6 Main balls

Skip to the sum table

By adding up the values of the main balls in each draw, the most common values (sums) can be counted up and displayed graphically.
This way you can compare your ticket with the trend and see how often a predicted result with a particular sum occurs. The lowest possible sum is 21 (1,2,3,4,5,6) and the highest 279 (44,45,46,47,48,49).
So far this has never happened and indeed no draw has yet had a sum anywhere near these limits.
Between these values there are 258 possible other values for the sum of 6 balls. Before even the first draw in the lottery took place it was possible to predict the distribution of these sums because they follow the
Normal distribution curve.
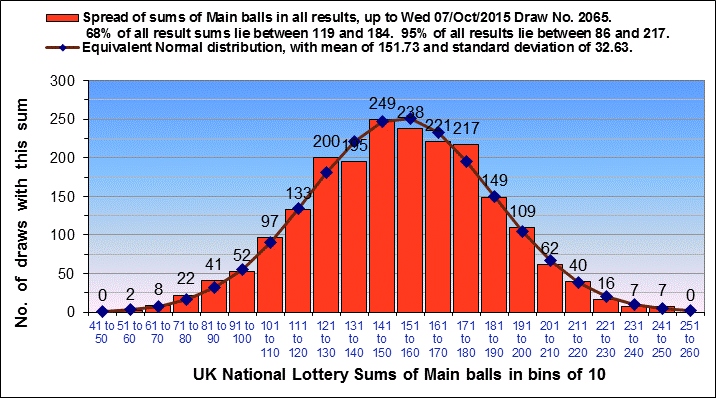
Theoretically the average sum is 150. This and other statistics can be compared with reality by examining the chart below.
The sums have been grouped in bands of 10 and the total number of draws which have sums within the shown range are plotted.


The standard deviation figure tells us where the bulk of the sums occur, e.g 68% of all values lie in a range between one standard deviation less than the mean and one standard deviation more than the mean. 95% of all sums lie between 2 standard deviations plus and minus the mean.


If you had a ticket in which all the main balls added to between 61 and 70 , then in theory you had about 4 chances so far of a result falling in that category. In practice, it has happened 6 times.

Expected and actual results tables

It is possible to work out exactly how many lottery result lines will have a particular total, and therefore have sums falling within a particular range. One can then compare this with what actually happens during the history of the lottery.

Some lottery lines, for example have a very low sum say in the range 21 to 30. You may be interested to know that there are only 90 possible tickets with this sum, out of 13,983,816 possible combinations of six numbers from 49. On average then, in theory you may have to wait 155,376 draws or 1,494 years until the first result within this range happens. On the other hand it can happen in the next draw. Contrast that with sums in the range 140 to 150 where there are 1,638,159 possible tickets with this sum. On average, a result matches this criteria once every 8.5 draws. It is possible therefore to calculate when a result in a sum range is due , and when it is overdue. However, a huge number of draws are required before sufficient data can be collected about the higher and lower sum values. Hence only figures about mid range values are viable.

The table below shows the figures discussed above for all the sum ranges. You will recognise the column in red - "Actual No of draws matching sum" as those plotted in the chart above. Where sufficient data is available the difference between theory and reality is shown, and The number of times overdue of the laggards are shown.

For example at the time of writing, numbers in the 181 to 190 range were expected to have appeared 64.74 times by draw 935 at an average rate of every 14.44 draws. They had appeared 64 times, and were hence on target. However, numbers in the range 91 to 100 should have come out 30 times by this draw number, but had actually been drawn 21 times. They were last drawn 44 draws ago and were 44/30.81 =1.43 times overdue. An overdue figure of less than one means it is not overdue, whereas 2, 3 or 4 times overdue would suggest a result in this range must be due soon.

Distribution of Tickets across the sum ranges at draw 2065

Mainball_ sums adding to between
Theoretical
Number of
different tickets
within the range
Group is
expected to
have matching
sum every draws
Theoretical   Actual Draws
ahead/ behind on total count
Last drawn how many draws ago Times
Overdue
% of tickets with this sum draws which should match sum to date   No of draws
matching sum
%
of tickets
21 to 30 90 155,376 0.00064% 0.0133 0 0.00% -0.0133 Never  
31 to 40 1,141 12,256 0.008% 0.1685 0 0.00%-0.1685 Never  
41 to 50 6,110 2,289 0.044% 0.9023 0 0.00% -0.9023 Never  
51 to 60 21,426 653 0.153% 3.1640 2 0.10%-1.164 147 0.23
61 to 70 58,331 240 0.417% 8.614 8 0.39% -0.614 594 2.48
71 to 80 132,841 105.27 0.950% 19.617 22 1.07%2.3833 78 0.74
81 to 90 261,351 53.51 1.869% 38.59 41 1.99% 2.4061 106 1.98
91 to 100 453,861 30.81 3.246% 67.02 52 2.52%-15.02 21 0.68
101 to 110 707,047 19.78 5.056% 104.41 97 4.70% -7.41 14 0.71
111 to 120 997,894 14.01 7.14% 147.36 133 6.44%-14.36 1 0.07
121 to 130 1,283,726 10.89 9.18% 189.57 200 9.69% 10.43 2 0.18
131 to 140 1,512,817 9.24 10.82% 223.40 195 9.44%-28.40 10 1.08
141 to 150 1,638,159 8.54 11.71% 241.91 249 12.06% 7.09 0 0.00
151 to 160 1,631,310 8.57 11.67% 240.90 238 11.53%-2.90 13 1.52
161 to 170 1,493,902 9.36 10.68% 220.61 221 10.70% 0.39 17 1.82
171 to 180 1,256,837 11.13 8.99% 185.60 217 10.51%31.40 3 0.27
181 to 190 968,215 14.44 6.92% 142.98 149 7.22% 6.02 33 2.28
191 to 200 679,482 20.58 4.86% 100.34 109 5.28%8.66 27 1.31
201 to 210 431,692 32.39 3.09% 63.75 62 3.00% -1.75 20 0.62
211 to 220 245,704 56.91 1.757% 36.28 40 1.94%3.72 9 0.16
221 to 230 123,205 113.50 0.881% 18.19 16 0.77% -2.19 121 1.07
231 to 240 53,239 262.66 0.381% 7.862 7 0.34%-0.862 487 1.85
241 to 250 19,152 730 0.1370% 2.828 7 0.34% 4.172 75 0.10
251 to 260 5,288 2,644 0.0378% 0.781 0 0.00%-0.7809 Never  
261 to 270 932 15,004 0.0067% 0.1376 0 0.00% -0.1376 Never  
271 to 280 64 218,497 0.0005% 0.0095 0 0.00%-0.0095 Never  
TOTALS 13,983,816 N/A 100.00% 2065 2065 100.00% N/A    
                 08-10-2015 11:33


Frequency Analysis Colour Analysis Temp. Analysis Chi-Squared Unchooser Archive Lottery Links Local Links Excel Links