 |
When the UK lottery was about to commence in 1994 a lottery pundit in the National press made some interesting observations about other lotteries. He said that The Chi- squared value for all new lotteries increased in the first few months of operation. The UK lottery was likely to do the same thing .
I didn't know what chi squared was or whether it told us anything useful but was curious to know more so I did some reading. Knowing that Microsoft Excel had Chi-square functions built in , did my own analysis.
Excels Chitest function applied to a range of actual results and compared with another range of hypothesized results, returns a chi-test value between 0 and 1 . The significance of this is that the nearer to zero the result , the more inaccurate the hypothesis. Conversely the nearer to 1 the result, the more your hypothesis is correct.
So what hypothesis were they testing in those other lotteries ? I assume the obvious hypothesis is :-
Given time after many draws, if you count up how many times each ball has
been drawn including as bonus ball, they will all eventually approach the same number of times drawn.
|
So , based on this assumption I have plotted the
chi-squared values of ball counts of each draw from draw 1 up to recent times to see what happens.
Below is my plot of the Chi squared values calculated from each draw in the UK Lottery up to recently, based on the hypothesis that (in theory ) all balls should eventually be drawn an equal number of times. For the first two and a half years the value was more than 0.7 and spent many months closer to 0.9.
Things began to change in June 1997 when quite rapidly it fell to 0.3 and over the 2 years since then, the Chi squared value has been down to the 0.2 mark with only brief excursions upward, now around 0.4.
This means that up to 1997, whereas one could reasonably expect cold balls to be chosen by the machines (hence high chi-square values), this is no longer the case. Repeated selection of warm and hot balls in the late nineties led to low chi-square values. They have recovered in recent years. Some other National Lotteries and Fantasy lotteries using random numbers are shown for comparison. |
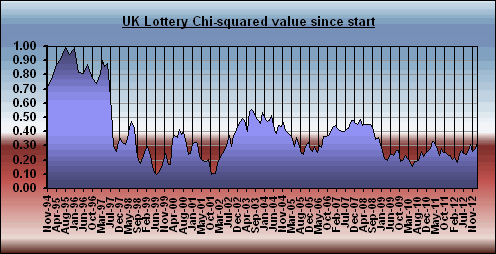 |
The chi square plot is a beautiful snapshot of the whole lottery from inception and the shape can change dramatically when selection trends change. After the third year - draw results were such that ball counts tended to become more unequal, hence the sharp fall in the graph.
|
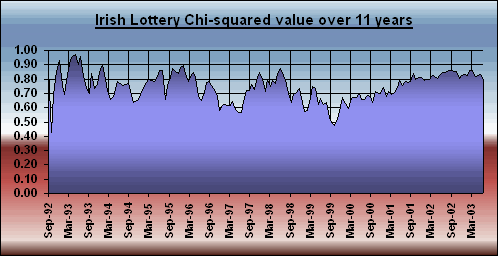 |
The Irish lottery chi square plot when using the same hypothesis has shown consistently high values over the first ten years showing a trend to favour draws which lead to an equalization in ball count in the long term. With 42 balls instead of 49, this is easier to achieve. |
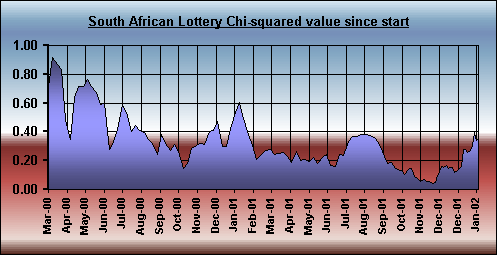 |

The South African Lottery, like the UK uses 49 balls. Chi square is quite volatile, but it's only 2 years old, early days, and hasn't settled down yet. |
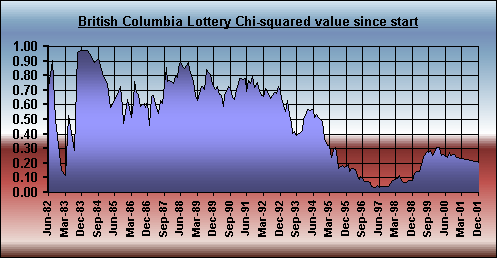 |

The British Columbia Lottery, like the UK uses 49 balls. An example of a long standing lottery 10 years of age which unlike the UK has maintained reasonable chi square values. |
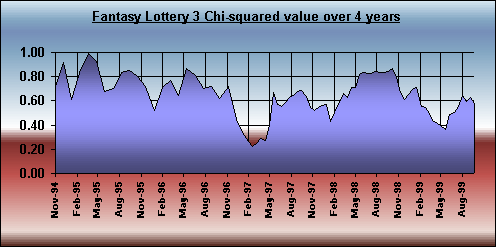 |

This Trial of 400 completely random "draws" of 7 balls produced this chi square plot which is more symmetrical over time than the real thing and averages about 0.4 |
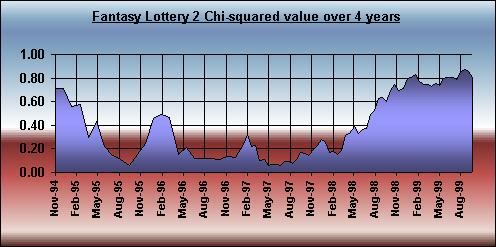
|
This simulation of 400 different random "draws" of 7 balls produced this chi square plot which had very low chi square values over prolonged periods. There is a dramatic recovery over the next 100 "draws |
In spite of trawling through the internet I have never seen anyone else's plot of chi-square values on this or any other lottery . Hence I don't know whether statistics experts would agree or disagree with my graphs. Maybe they would make different hypotheses anyway ? I would be interested in seeing other peoples results, if they have looked at this. Please don't send me university theses on the subject, because it's beyond me !

|
 |
 |
|
|


