Balls summarised by colour


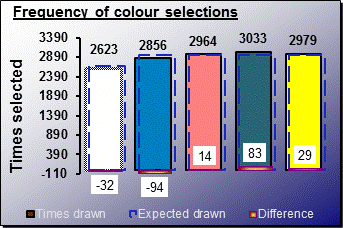
This section looks at whether the colour groups have been drawn more or less than might be expected as per the law of averages. The table and chart immediately below compares the total number of times since draw 1 that any white ball has been drawn compared with what might be expected on average given sufficient time.This process is also applied to all the other colours.
Note:-
The term frequency means simply total count of times drawn including as a bonus ball.

Note there are only 9 white balls for 10 of each other colour.You therefore expect to see less whites than any other colour drawn.
Lottery data after 2065 draws up to Wed 07/10/15
Colour Expected Actual Difference
Frequency Frequency
WHITES 2655 2623 -32
BLUES 2950 2856 -94
PINKS 2950 2964 14
GREENS 2950 3033 83
YELLOWS 2950 2979 29


The difference between the average expected frequency and the actual frequency is shown in the table and on the graph below.The dotted line near the top of each bar is the expected value based on averages.


Individual colour group Odd/Even charts


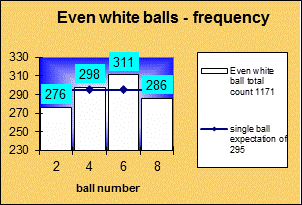
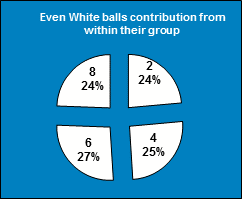
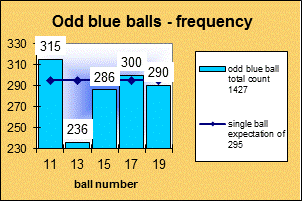
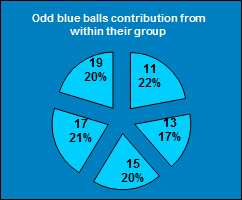
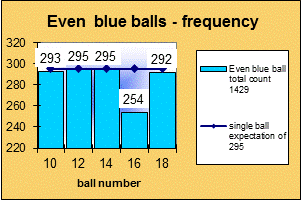
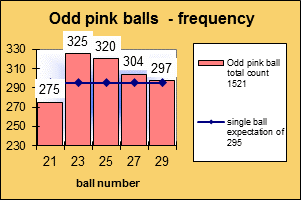
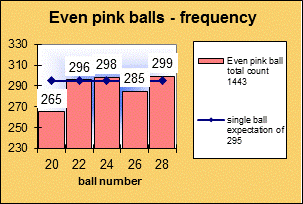
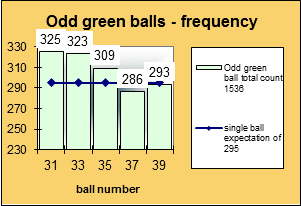
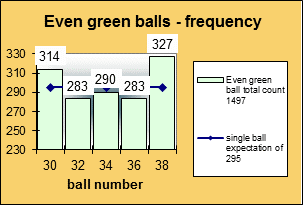
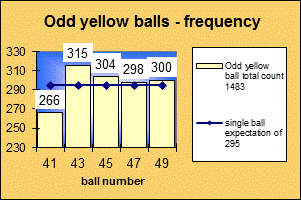
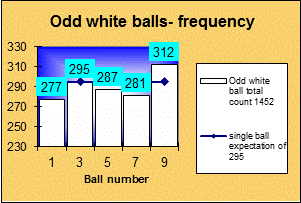
The single ball expectation is how many times you'd expect any one ball to be drawn up to now. It is the same for all balls and is calculated from the draw number divided by 7. (This is derived from the draw number multiplied by 7 and divided by 49.)The charts below use this figure.
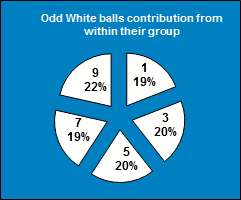
ChartObject Odd white balls- frequency ChartObject Odd White balls contribution from within their group
 
ChartObject Even white balls - frequency ChartObject Even White balls contribution from within their group
ChartObject Odd blue balls - frequency ChartObject Odd blue balls contribution from within their group
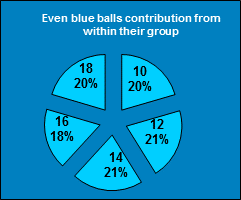
ChartObject Even  blue balls - frequency ChartObject Even  blue balls contribution from within their group
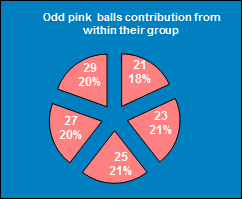
ChartObject Odd pink balls  - frequency ChartObject Odd pink  balls contribution from within their group 
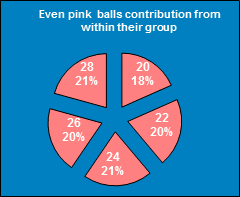
ChartObject Even pink balls - frequency ChartObject Even pink  balls contribution from within their group
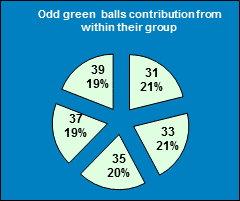
ChartObject Odd green balls - frequency ChartObject Odd green  balls contribution from within their group
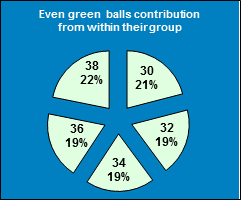
ChartObject Even green balls - frequency ChartObject Even green  balls contribution from within their group
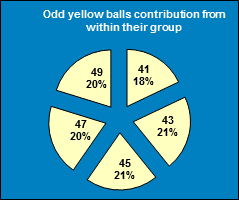
ChartObject Odd yellow balls - frequency ChartObject Odd yellow balls contribution from within their group
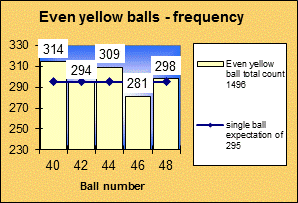
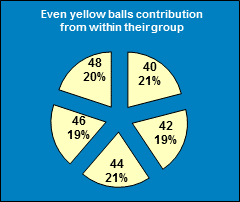
ChartObject Even yellow balls - frequency ChartObject Even yellow balls contribution from within their group


Temp Analysis Sums Frequency Analysis Chi-Squared Unchooser Archive Lottery Links Local Links Excel Links